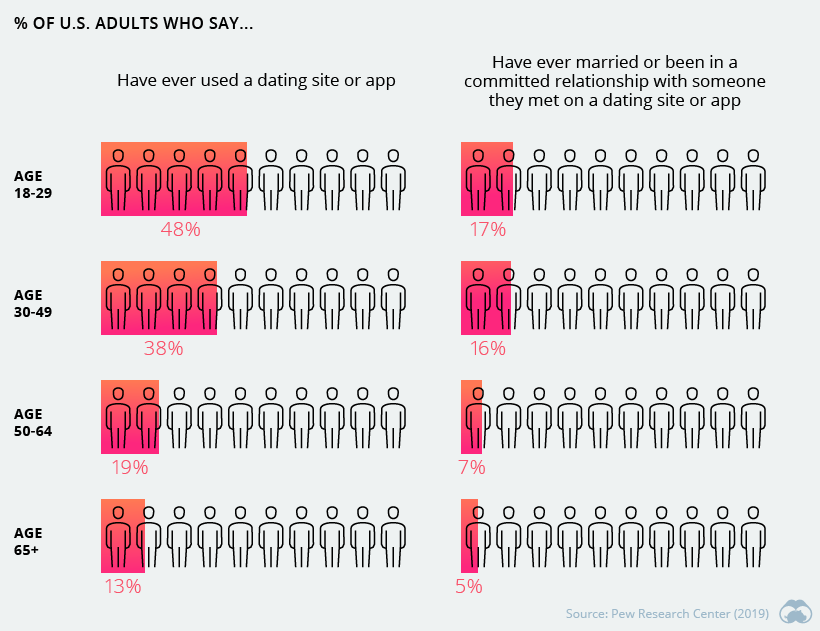
The digital era has helped fuel a surge in mobile and online dating among younger, tech-savvy generations. In fact, almost half of Americans today between the ages of 18 and 29 years old report having used a dating site or app to find a partner.
For the millions of people around the world diving into the world of digital dating, there are dozens of online dating platforms to choose from. Increasingly though, many of these brands are controlled by a single company.
A Match Made In Heaven
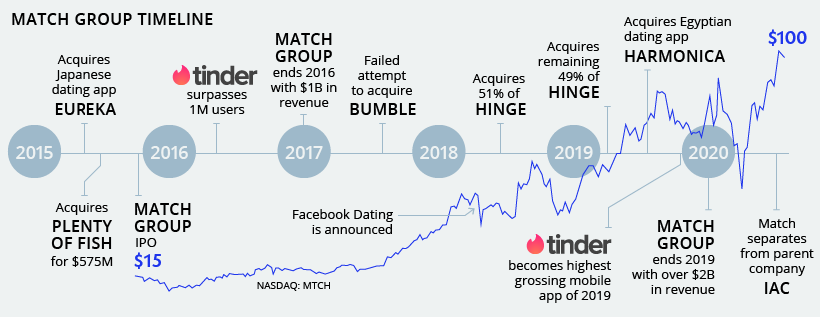
Forget traditional face-to-face interactions—online dating has emerged as the most popular way couples are meeting today. Though the volume of users is increasingly large, the number of companies in the space continues to narrow. The largest in this space, Match Group, has gone all-in on online dating, acquiring some 20 companies throughout its brief history. As a result, Match Group now has an impressive 45 dating services in its growing roster.
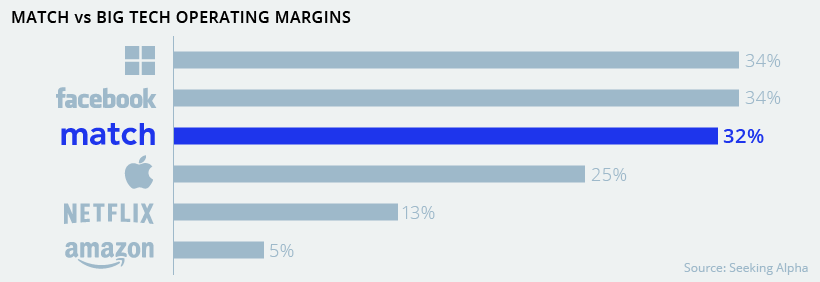
Taking a familiar page out of the Big Tech playbook, Match Group’s big bet has so far paid off. They’ve managed to execute on an asset-light, software-based subscription model that results in plenty of recurring revenue. This strategy has also led to operating margins that rival those of Big Tech companies like Facebook or Microsoft.
The result? Since their 2015 IPO, Match Group’s stock is up 600%, reaching a market capitalization of $25 billion, eclipsing many other well-known household names.
Wall Street Swipes Right
While Match Group does frequently boast about its diverse set of dating platforms, much of the success boils down to a few moving parts. One big part in particular, is Tinder and its impressive userbase of 59 million people. Tinder’s “army of swipers” continues to grow. If the app’s userbase were a country, it would rank 25th in the world. Alternatively, imagine if every citizen of Canada, Jamaica, Ireland, Sweden, and Albania combined decided to pop open their app store and download Tinder at the same time.
Tinder now has upwards of 6 million paid subscribers, charging a subscription fee around $20 per month. These revenues continue to form a large piece of the overall equation. How important is Tinder for Match? In their investor presentations, they provide separate data on Tinder while labeling all other apps under the “All Other Brands” category.
In recent times, Match Group has commented that they see “traditional dating” as their biggest competitor. Socio-cultural, demographic, and tech trends seem to suggest mobile online dating is not just a fad, but a concrete and dominant means through which people connect.
User growth figures have not shown weakness either. Both Millennials and Gen Z make up the bulk of Match Group’s userbase—and both generations are comfortable with digitalization as well as delaying life milestones such as marriage. This may suggest their layover in the so-called “dating period” will be lengthy—good news for giants like Match Group.
on
Last year, stock and bond returns tumbled after the Federal Reserve hiked interest rates at the fastest speed in 40 years. It was the first time in decades that both asset classes posted negative annual investment returns in tandem.
Over four decades, this has happened 2.4% of the time across any 12-month rolling period.
To look at how various stock and bond asset allocations have performed over history—and their broader correlations—the above graphic charts their best, worst, and average returns, using data from Vanguard.
How Has Asset Allocation Impacted Returns?
Based on data between 1926 and 2019, the table below looks at the spectrum of market returns of different asset allocations:
We can see that a portfolio made entirely of stocks returned 10.3% on average, the highest across all asset allocations. Of course, this came with wider return variance, hitting an annual low of -43% and a high of 54%.
A traditional 60/40 portfolio—which has lost its luster in recent years as low interest rates have led to lower bond returns—saw an average historical return of 8.8%. As interest rates have climbed in recent years, this may widen its appeal once again as bond returns may rise.
Meanwhile, a 100% bond portfolio averaged 5.3% in annual returns over the period. Bonds typically serve as a hedge against portfolio losses thanks to their typically negative historical correlation to stocks.
A Closer Look at Historical Correlations
To understand how 2022 was an outlier in terms of asset correlations we can look at the graphic below:
The last time stocks and bonds moved together in a negative direction was in 1969. At the time, inflation was accelerating and the Fed was hiking interest rates to cool rising costs. In fact, historically, when inflation surges, stocks and bonds have often moved in similar directions. Underscoring this divergence is real interest rate volatility. When real interest rates are a driving force in the market, as we have seen in the last year, it hurts both stock and bond returns. This is because higher interest rates can reduce the future cash flows of these investments. Adding another layer is the level of risk appetite among investors. When the economic outlook is uncertain and interest rate volatility is high, investors are more likely to take risk off their portfolios and demand higher returns for taking on higher risk. This can push down equity and bond prices. On the other hand, if the economic outlook is positive, investors may be willing to take on more risk, in turn potentially boosting equity prices.
Current Investment Returns in Context
Today, financial markets are seeing sharp swings as the ripple effects of higher interest rates are sinking in. For investors, historical data provides insight on long-term asset allocation trends. Over the last century, cycles of high interest rates have come and gone. Both equity and bond investment returns have been resilient for investors who stay the course.
