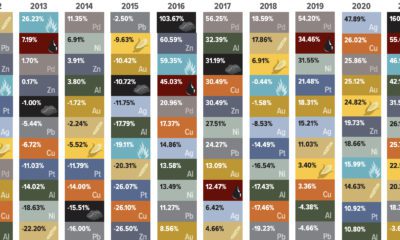
But picking gold mining stocks isn’t easy, as each company has a variety of individual projects and risks worth assessing. This is why the GDX (VanEck Vectors Gold Miners ETF), is one of the most popular methods investors choose to get exposure to players in the gold mining industry. While the GDX and gold miners can generally offer leveraged upside compared to gold during bull markets, in 2020 the GDX returned 23%, just a couple of points shy from spot gold’s 25.1% return. This graphic compares the returns of gold, the GDX, and the best and worst performing gold mining equities in the index.
Understanding the GDX ETF and its Value
The GDX is one of many index ETFs created by investment management firm VanEck and offers exposure to 52 of the top gold mining stocks. It provides a straightforward way to invest in the largest names in the gold mining industry, while cutting down on some of the individual risks that many mining companies are exposed to. The GDX is VanEck’s largest and most popular ETF averaging ~$25M in volume every day, with the largest amount of total net assets at $15.3B. In terms of its holdings, the GDX attempts to replicate the returns of the NYSE Arca Gold Miners Index (GDM), which tracks the overall performance of companies in the gold mining industry.
How the Largest Gold Miners Performed in 2020
As a market-cap weighted ETF, the GDX allocates more assets towards constituents with a higher market cap, resulting in larger gold mining companies making up more of the index’s holdings. This results in the five largest companies in the GDX making up 39.5% of the index’s holdings, and the top 10 making up 59.3%. An equally-weighted index of the top five GDX constituents returned 27.3% for the year, outperforming gold and the index by a few points. Meanwhile, an equally-weighted index of the top 10 constituents significantly underperformed, only returning 18.4%. Newmont was the only company of the top five which outperformed gold and the overall index, returning 37.8% for the year. Wheaton Precious Metals (40.3%) and Kinross Gold (54.9%) were the only other companies in the top 10 that managed to outperform. Kinross Gold was the best performer among the top constituents largely due to its strong Q3 results, where the company generated significant free cash flow while quadrupling reported net earnings. Along with these positive results, the company also announced its expectation to increase gold production by 20% over the next three years.
The Best and Worst Performers in 2020
Among the best and worst performers of the GDX, it was the smaller-sized companies in the bottom half of the ranking which either significantly over- or underperformed. K92 Mining’s record gold production from their Kainantu gold mine, along with a significant resource increase at their high-grade Kora deposit nearby saw a return of 164.2%, with the company graduating from the TSX-V to the TSX at the end of 2020. Four of the five worst performers for 2020 were Australian mining companies as the country entered its first recession in 30 years after severe COVID-19 lockdowns and restrictions. Bushfires early in the year disrupted shipments from Newcrest’s Cadia mine, and rising tensions with China (Australia’s largest trading partner) also contributed to double-digit drawdowns for some Australian gold miners. The worst performer and last-ranked company in the index, Resolute Mining (-36.9%), had further disruptions in H2’2020 at their Syama gold mine in Mali. The military coup and resignation of Mali’s president Ibrahim Keïta in August was followed by unionized workers threatening strikes in September, slowing operations at Syama gold mine. Outright strikes eventually occurred before year’s end.
How Gold Mining Stocks are Chosen for the GDX
There are some ground rules which dictate how the index is weighted to ensure the GDM and GDX properly reflect the gold mining industry. Along with the rules on the index’s weighting, there are company-specific requirements for inclusion into the GDM, and as a result the GDX:
Derive >50% of revenues from gold mining and related activities Market capitalization >$750M Average daily volume >50,000 shares over the past three months Average daily value traded >$1M over the past three months
Gold mining stocks already in the index have some leeway regarding these requirements, and ultimately inclusion or exclusion from the index us up to the Index Administrator.
What 2021 Will Bring for Gold Mining Stocks
The GDX has had a muted start to the new year, with the index at -2.3% as it has mostly followed spot gold’s price. Gold and gold mining stocks cooled off significantly following their strong rally Q1-Q3’2020, as positive developments regarding the COVID-19 vaccine have resulted in a stronger-than-expected U.S. dollar and a rise in treasury yields. This being said, the arrival of new monetary stimulus in the U.S. could spur inflation-fearing investors towards gold and gold mining stocks as the year progresses. on Last year, stock and bond returns tumbled after the Federal Reserve hiked interest rates at the fastest speed in 40 years. It was the first time in decades that both asset classes posted negative annual investment returns in tandem. Over four decades, this has happened 2.4% of the time across any 12-month rolling period. To look at how various stock and bond asset allocations have performed over history—and their broader correlations—the above graphic charts their best, worst, and average returns, using data from Vanguard.
How Has Asset Allocation Impacted Returns?
Based on data between 1926 and 2019, the table below looks at the spectrum of market returns of different asset allocations:
We can see that a portfolio made entirely of stocks returned 10.3% on average, the highest across all asset allocations. Of course, this came with wider return variance, hitting an annual low of -43% and a high of 54%.
A traditional 60/40 portfolio—which has lost its luster in recent years as low interest rates have led to lower bond returns—saw an average historical return of 8.8%. As interest rates have climbed in recent years, this may widen its appeal once again as bond returns may rise.
Meanwhile, a 100% bond portfolio averaged 5.3% in annual returns over the period. Bonds typically serve as a hedge against portfolio losses thanks to their typically negative historical correlation to stocks.
A Closer Look at Historical Correlations
To understand how 2022 was an outlier in terms of asset correlations we can look at the graphic below:
The last time stocks and bonds moved together in a negative direction was in 1969. At the time, inflation was accelerating and the Fed was hiking interest rates to cool rising costs. In fact, historically, when inflation surges, stocks and bonds have often moved in similar directions. Underscoring this divergence is real interest rate volatility. When real interest rates are a driving force in the market, as we have seen in the last year, it hurts both stock and bond returns. This is because higher interest rates can reduce the future cash flows of these investments. Adding another layer is the level of risk appetite among investors. When the economic outlook is uncertain and interest rate volatility is high, investors are more likely to take risk off their portfolios and demand higher returns for taking on higher risk. This can push down equity and bond prices. On the other hand, if the economic outlook is positive, investors may be willing to take on more risk, in turn potentially boosting equity prices.
Current Investment Returns in Context
Today, financial markets are seeing sharp swings as the ripple effects of higher interest rates are sinking in. For investors, historical data provides insight on long-term asset allocation trends. Over the last century, cycles of high interest rates have come and gone. Both equity and bond investment returns have been resilient for investors who stay the course.


