From the fertile farmland of the Great Plains to the volcanic islands in the Hawaiian archipelago, each state has been dealt a unique geographical hand. Each geographical setting can be the source of economic opportunities, such as tourism or the development of natural resources. It also partially dictates what kind of agricultural choices are available for farmers and local economies.
A Higher Level Look
Today’s infographic comes to us from HowMuch.net, and it color codes each state based on the most valuable agricultural commodity it produces, based on data from the U.S. Department of Agriculture. At a big picture level, how does the country break down? Broadly speaking, the category of “Grains, oilseeds, dry beans, and dry peas” is the most valuable agricultural commodity in 16 states, while aquaculture was the most important in only one state, which is Alaska. It’s interesting that there are niches that end up deriving massive amounts of value in only a few states. For example, the category of “Fruit, tree nuts, and berries” is the biggest in just three states, but California makes $17.6 billion from it every year – more than the size of the entire agricultural sector of some states.
State by State Data
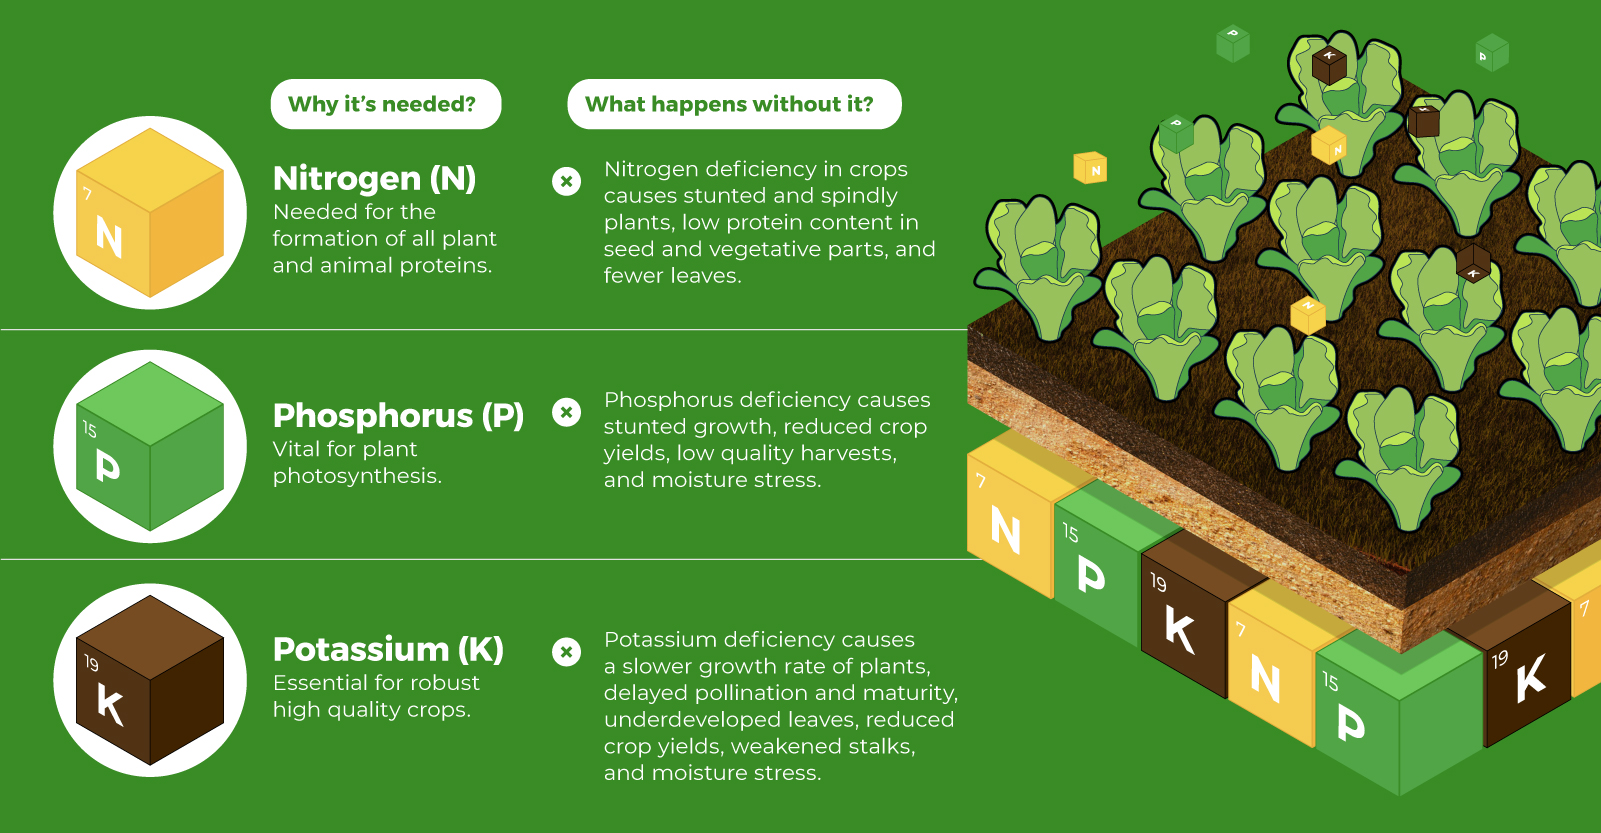
Finally, here’s a look at the data for each state in a sortable table: As the legal cannabis industry continues to take off, it’ll be interesting to see if the USDA incorporates that crop into its rankings in future years. on Over recent decades, farmers have been able to more than double their production of crops thanks to fertilizers and the vital nutrients they contain. When crops are harvested, the essential nutrients are taken away with them to the dining table, resulting in the depletion of these nutrients in the soil. To replenish these nutrients, fertilizers are needed, and the cycle continues. The above infographic by Brazil Potash shows the role that each macronutrient plays in growing healthy, high-yielding crops.
Food for Growth
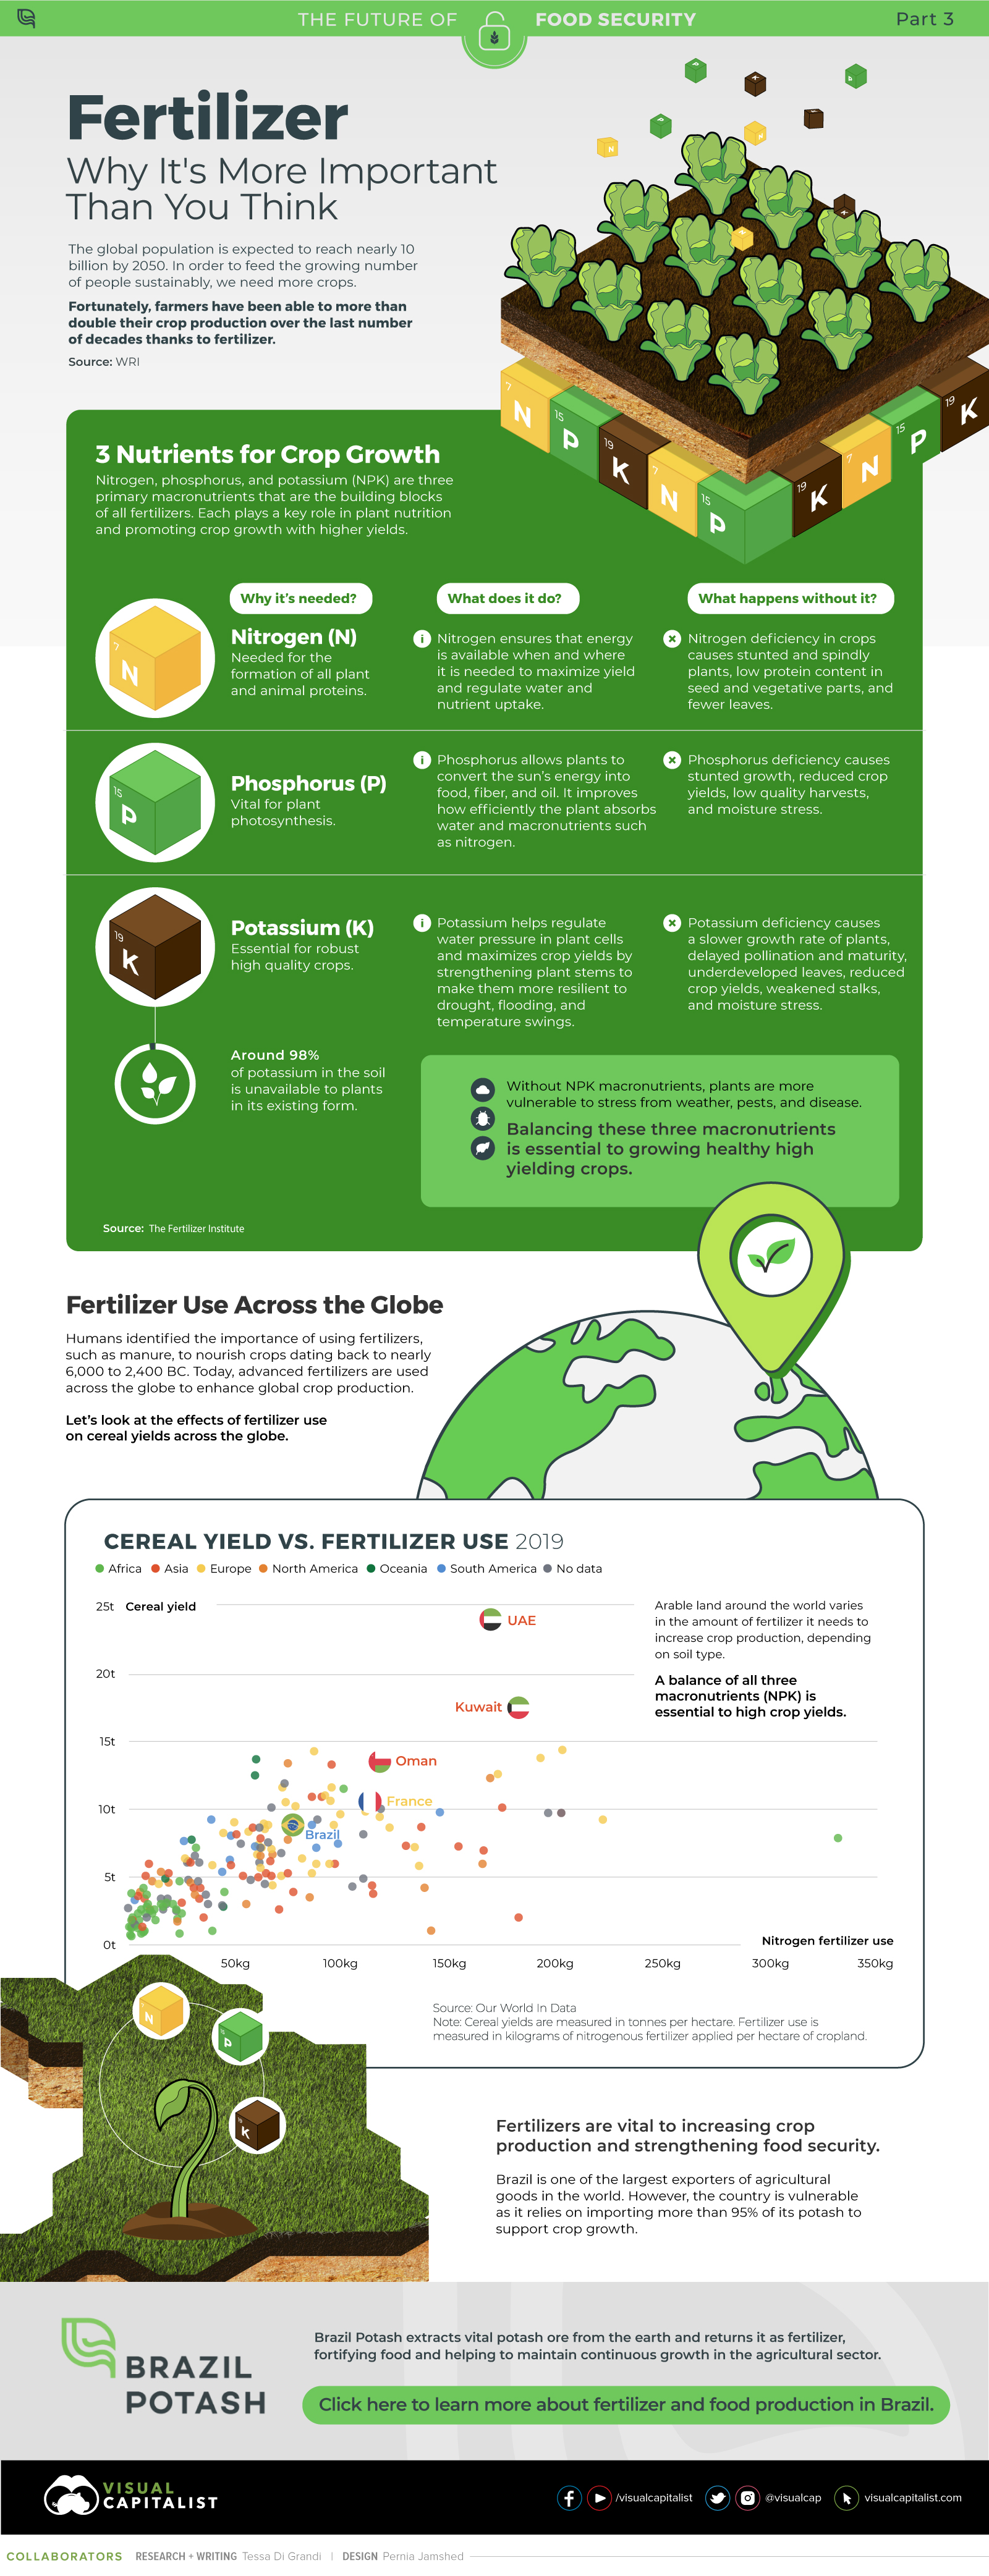
Nitrogen, phosphorus, and potassium (NPK) are three primary macronutrients that are the building blocks of the global fertilizer industry. Each plays a key role in plant nutrition and promoting crop growth with higher yields. Let’s take a look at how each macronutrient affects plant growth. If crops lack NPK macronutrients, they become vulnerable to various stresses caused by weather conditions, pests, and diseases. Therefore, it is crucial to maintain a balance of all three macronutrients for the production of healthy, high-yielding crops.
The Importance of Fertilizers
Humans identified the importance of using fertilizers, such as manure, to nourish crops dating back to nearly 6,000 to 2,400 BC. As agriculture became more intensive and large-scale, farmers began to experiment with different types of fertilizers. Today advanced chemical fertilizers are used across the globe to enhance global crop production. There are a myriad of factors that affect soil type, and so the farmable land must have a healthy balance of all three macronutrients to support high-yielding, healthy crops. Consequently, arable land around the world varies in the amount and type of fertilizer it needs. Fertilizers play an integral role in strengthening food security, and a supply of locally available fertilizer is needed in supporting global food systems in an ever-growing world. Brazil is one of the largest exporters of agricultural goods in the world. However, the country is vulnerable as it relies on importing more than 95% of its potash to support crop growth. Brazil Potash is developing a new potash project in Brazil to ensure a stable domestic source of this nutrient-rich fertilizer critical for global food security. Click here to learn more about fertilizer and food production in Brazil.
