That’s why we have previously visualized the country’s $18 trillion economy by comparing specific regions to similarly sized countries. It’s also why we have shown the extreme variance in population distribution across counties, or highlighted the average income of the “Top 1%” throughout the country. But there is perhaps nothing more telling or interesting to explore than the “granddaddy” of all economic maps: an interactive visualization of median household income. That’s why today’s fantastic interactive map from Overflow Data is such a treat. It covers all 3,007 U.S. counties using color coding to show the richest and poorest counties based on median income, and it also allows users to drill down to the stats on counties at the state level.
Coasts, Mountains, and Oil
While the areas around coastal cities like San Francisco, Los Angeles, New York City, Boston, or Washington, D.C. are often thought of as the wealthier parts of the country, this map helps reveal two other “belts” in the country with median incomes well above the national average of $53,889. The first is in the mountains through states like Utah, Colorado, Wyoming and even parts of Nevada – where there is a cluster of more than 40 counties with median incomes of $60,000 or above. Aside from upscale ski areas in places like Summit County, UT or Jackson, WY, the counties in this belt also feature cities like Boulder, CO, or Salt Lake City, UT. Areas that are rich in natural resources, such as parts of Alaska, Texas, and North Dakota, also tend to have more counties with above average median incomes. For example, Williams County, ND, is in the middle of the Bakken oilfield – and the median household income there is $88,013. In Alaska, the northernmost county of North Slope Borough has less than 8,000 residents, but they boast a median household income of $72,576.
Tougher Times
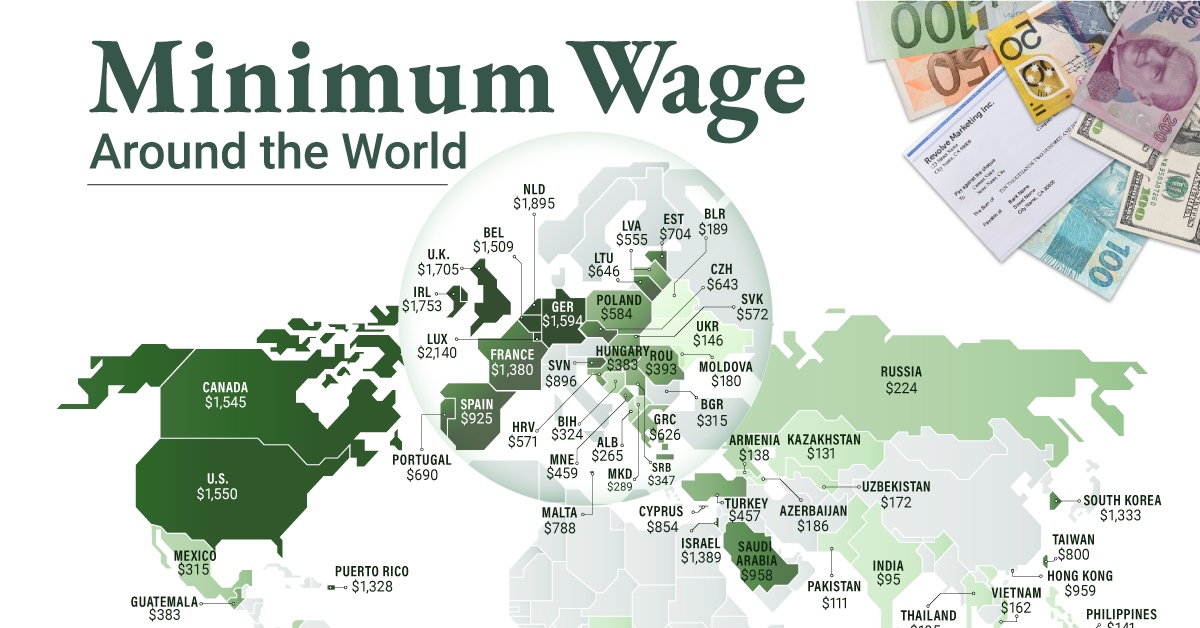
On this map, the less wealthy areas are also very evident – and they tend to be most concentrated in the Southeast region of the country. Many states, including ones like Kentucky, Alabama, Mississippi, Montana, Louisiana, Missouri, New Mexico, Arkansas, Texas, West Virginia, North Carolina, South Carolina, and South Dakota, all have some counties that are at the very low end of median income spectrum. More specifically, there are only two counties in the country that have income levels below $20,000: Sumter County, AL, and McCreary County, KY. on To see how the minimum wage differs around the world, we’ve visualized data from Picodi, which includes values for 67 countries as of January 2023.
Monthly Minimum Wage, by Country
The following table includes all of the data used in this infographic. Each value represents the monthly minimum wage a full-time worker would receive in each country. Picodi states that these figures are net of taxes and have been converted to USD. Generally speaking, developed countries have a higher cost of living, and thus require a higher minimum wage. Two outliers in this dataset are Argentina and Turkey, which have increased their minimum wages by 100% or more from January 2022 levels. Turkey is suffering from an ongoing currency crisis, with the lira losing over 40% of its value in 2021. Prices of basic goods have increased considerably as the Turkish lira continues to plummet. In fact, a 2022 survey found that 70% of people in Turkey were struggling to pay for food. Argentina, South America’s second-biggest economy, is also suffering from very high inflation. In response, the country announced three minimum wage increases throughout 2022.
Minimum Wage in the U.S.
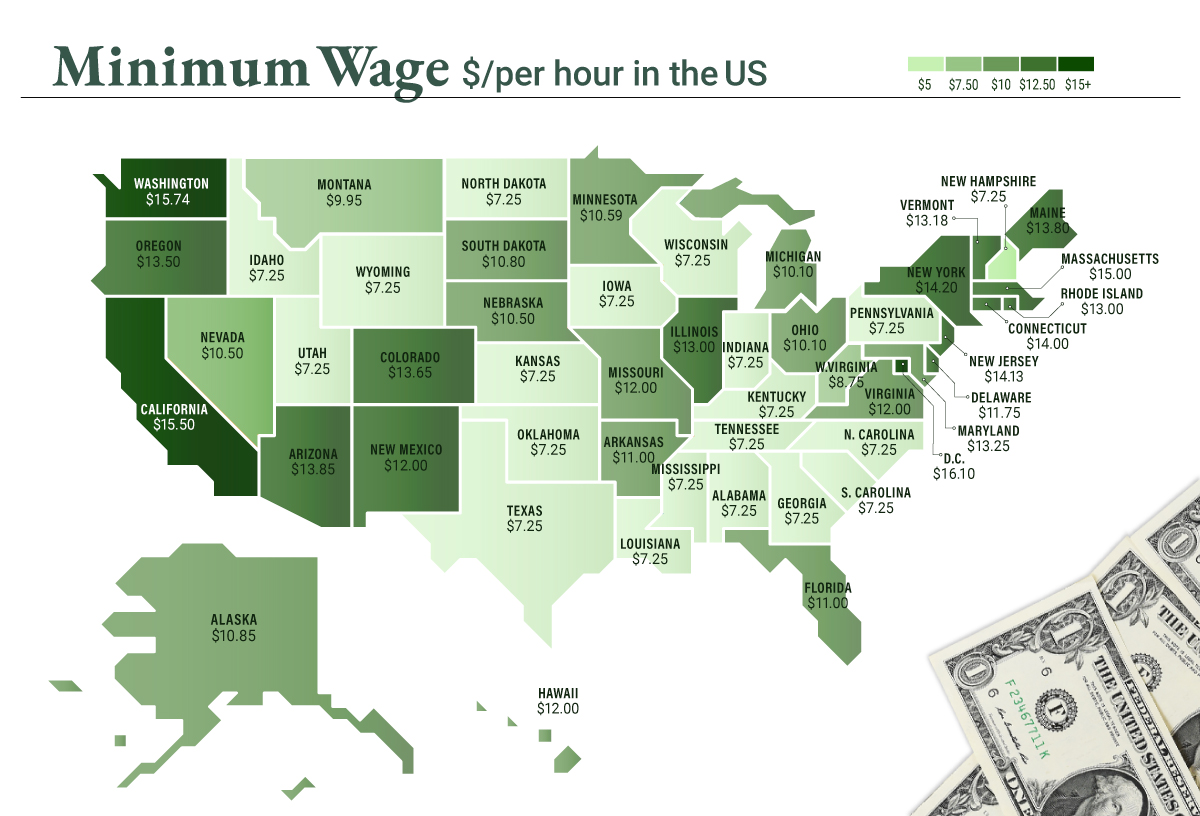
Within the U.S., minimum wage varies significantly by state. We’ve visualized each state’s basic minimum rate (hourly) using January 2023 data from the U.S. Department of Labor.
2023-03-17 Update: This map was updated to fix several incorrect values. We apologize for any confusion this may have caused. America’s federal minimum wage has remained unchanged since 2009 at $7.25 per hour. Each state is allowed to set their own minimum wage, as long as it’s higher than the federal minimum. In states that do not set their own minimum, the federal minimum applies. If we assume someone works 40 hours a week, the federal minimum wage of $7.25 translates to an annual figure of just $15,080 before taxes. California’s minimum wage of $15.50 translates to $32,240 before taxes. For further perspective, check out our 2022 infographic on the salary needed to buy a home across 50 U.S. cities.


