Millennials Investing With a Purpose
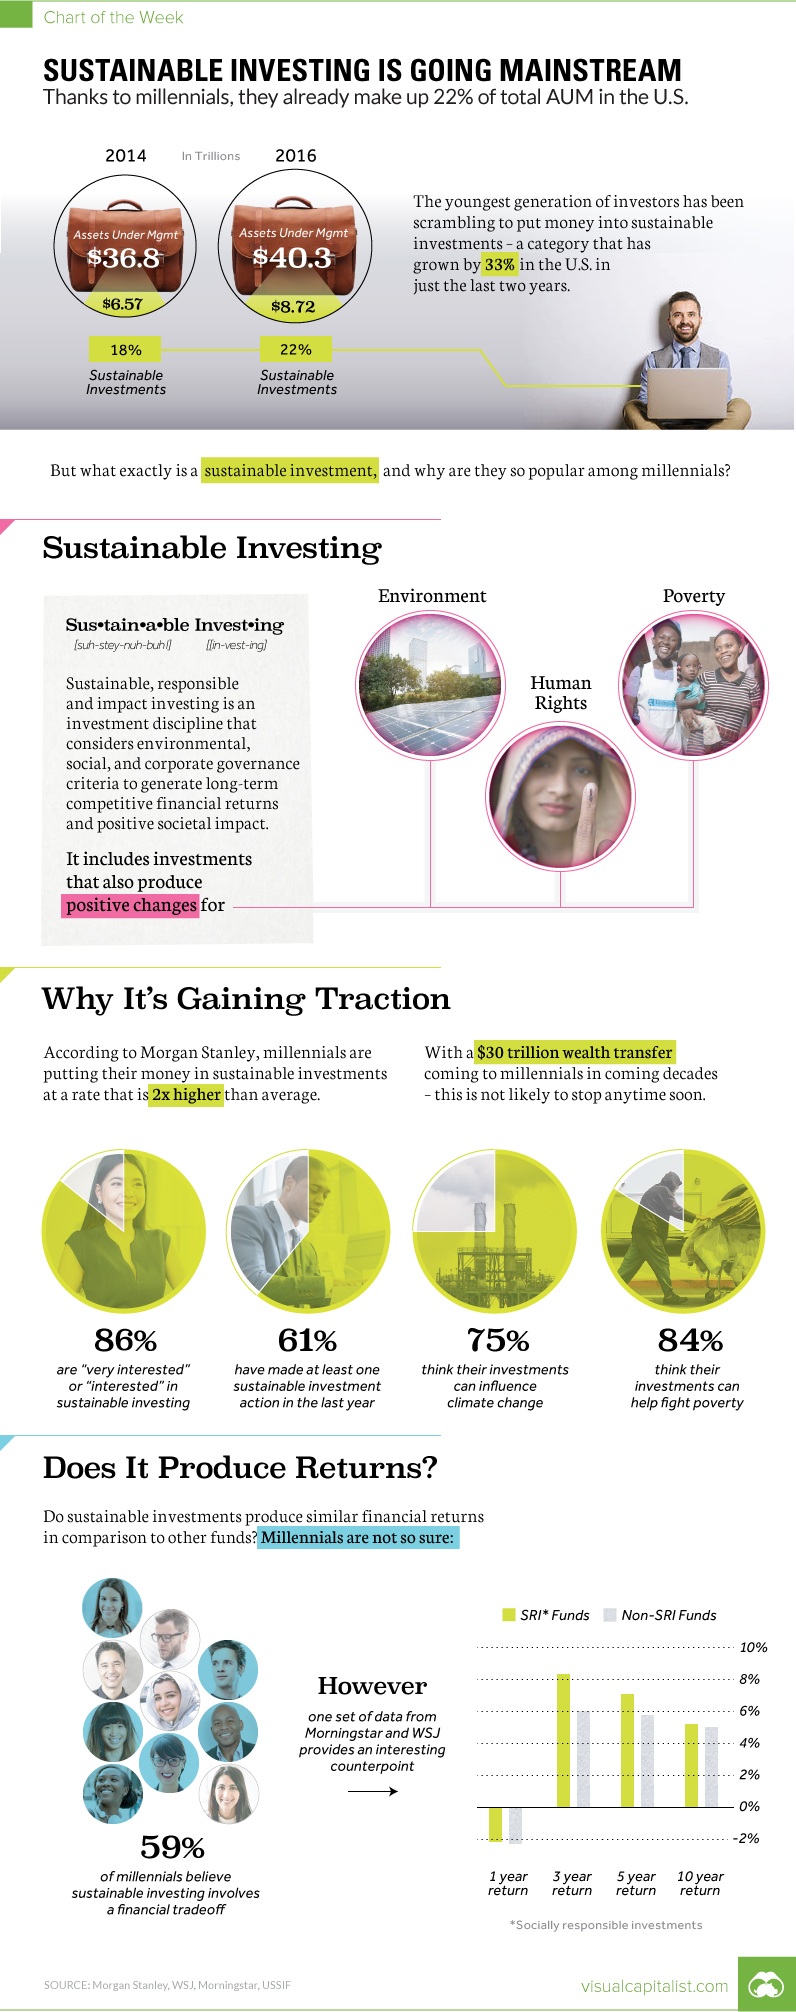
22% of Total AUM in U.S. are Sustainable Investments
The Chart of the Week is a weekly Visual Capitalist feature on Fridays. If you’ve been paying attention to your social media feeds or most news outlets, it should be pretty clear to you that millennials seem to be “killing” just about everything – from Applebee’s to the entire golf industry. While this “killing” meme is obviously a ridiculous hyperbole, there is at least some truth to it. As the largest generation in American history, millennials are gaining sway and buying power quickly – and businesses that do not take heed to their preferences could feel the burn. Even worse, over the long run, some industries and businesses may go the way of the dodo.
The Rise of Sustainable Investing
The latest thing that millennials are “killing”? It’s the act of investing solely just for financial returns. There’s mounting evidence that millennials are putting their money towards investments that have another component: making a positive societal impact. This practice is called sustainable investing, and it considers criteria around environmental, social, and corporate governance for investments in addition to the aspect of financial returns. Put another way, many millennials want to put their money towards companies and funds that are helping to do things like alleviate poverty, protect the environment, or further human rights around the world. They want to generate ROI in both financial and social spheres.
Proof in the Pudding
Over the last decade or so, the amount of assets under management (AUM) for sustainable investments has ballooned to a whopping $8.72 trillion in the U.S. for 2016:
Since 2014, that’s a 33% increase – and even more interestingly, sustainable investments now make up 22% of the $40.3 trillion of total AUM in the United States. Why is sustainable investing so popular among millennials? Here’s a rundown, mostly coming from recent research from Morgan Stanley:
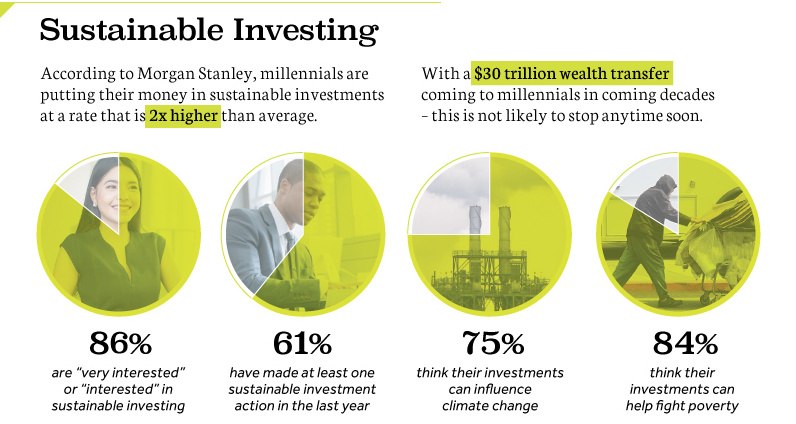
Millennials are putting money in sustainable investments at a rate 2x higher than average. 86% of millennial investors say they are “very interested” or “interested” in sustainable investing. 61% have made at least one sustainable investment action in the last year. 75% think their investments can influence climate change. 84% think their investments can help fight poverty.
And with a $30 trillion wealth transfer coming to millennials over the coming decades, this preference of using investments as a vehicle for creating positive social change is more than just a trend.
The Big Question
There does remain one big question that millennials and wealth managers are focused on: do sustainable investments provide similar financial returns to regular investments? Millennials are willing to take a risk that they don’t – in fact, Morgan Stanley found that 59% of millennials believe that there is a trade-off between social impact and financial returns. Interestingly, some data is already providing a counterpoint to this narrative. In a report from Morningstar and WSJ, for example, it’s shown that funds focused on sustainable investments have offered superior performance to non-sustainable investments over periods of one, three, five, and 10 years. Whether this stays true for the future remains to be seen – but it will be an important and fun metric to watch.
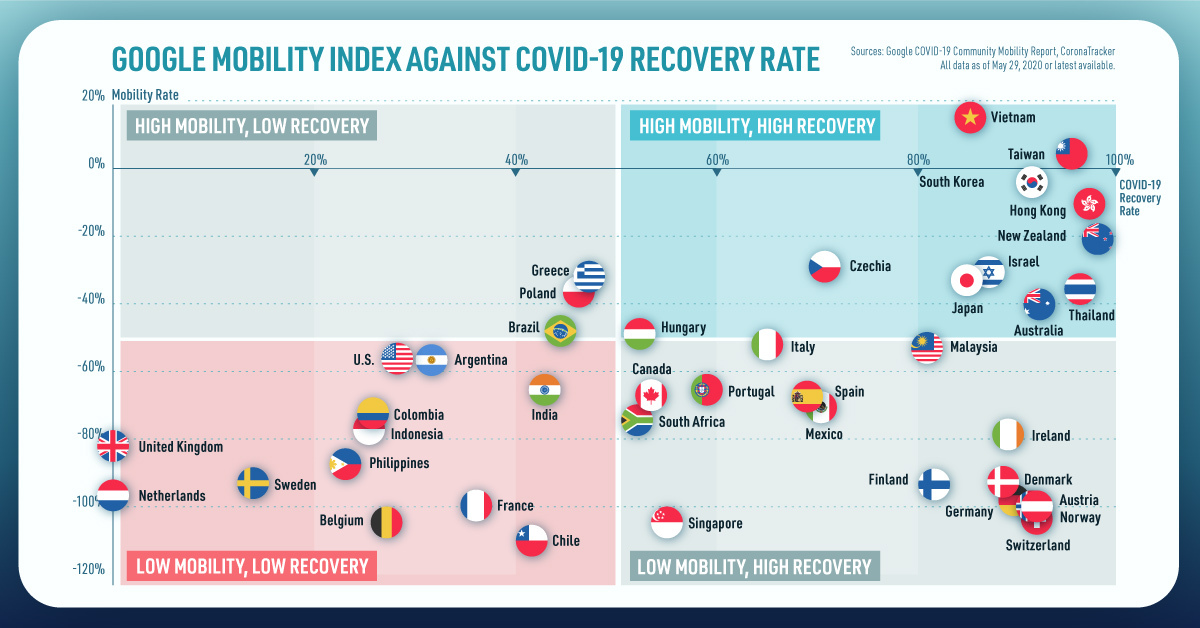
on Today’s chart measures the extent to which 41 major economies are reopening, by plotting two metrics for each country: the mobility rate and the COVID-19 recovery rate: Data for the first measure comes from Google’s COVID-19 Community Mobility Reports, which relies on aggregated, anonymous location history data from individuals. Note that China does not show up in the graphic as the government bans Google services. COVID-19 recovery rates rely on values from CoronaTracker, using aggregated information from multiple global and governmental databases such as WHO and CDC.
Reopening Economies, One Step at a Time
In general, the higher the mobility rate, the more economic activity this signifies. In most cases, mobility rate also correlates with a higher rate of recovered people in the population. Here’s how these countries fare based on the above metrics. Mobility data as of May 21, 2020 (Latest available). COVID-19 case data as of May 29, 2020. In the main scatterplot visualization, we’ve taken things a step further, assigning these countries into four distinct quadrants:
1. High Mobility, High Recovery
High recovery rates are resulting in lifted restrictions for countries in this quadrant, and people are steadily returning to work. New Zealand has earned praise for its early and effective pandemic response, allowing it to curtail the total number of cases. This has resulted in a 98% recovery rate, the highest of all countries. After almost 50 days of lockdown, the government is recommending a flexible four-day work week to boost the economy back up.
2. High Mobility, Low Recovery
Despite low COVID-19 related recoveries, mobility rates of countries in this quadrant remain higher than average. Some countries have loosened lockdown measures, while others did not have strict measures in place to begin with. Brazil is an interesting case study to consider here. After deferring lockdown decisions to state and local levels, the country is now averaging the highest number of daily cases out of any country. On May 28th, for example, the country had 24,151 new cases and 1,067 new deaths.
3. Low Mobility, High Recovery
Countries in this quadrant are playing it safe, and holding off on reopening their economies until the population has fully recovered. Italy, the once-epicenter for the crisis in Europe is understandably wary of cases rising back up to critical levels. As a result, it has opted to keep its activity to a minimum to try and boost the 65% recovery rate, even as it slowly emerges from over 10 weeks of lockdown.
4. Low Mobility, Low Recovery
Last but not least, people in these countries are cautiously remaining indoors as their governments continue to work on crisis response. With a low 0.05% recovery rate, the United Kingdom has no immediate plans to reopen. A two-week lag time in reporting discharged patients from NHS services may also be contributing to this low number. Although new cases are leveling off, the country has the highest coronavirus-caused death toll across Europe. The U.S. also sits in this quadrant with over 1.7 million cases and counting. Recently, some states have opted to ease restrictions on social and business activity, which could potentially result in case numbers climbing back up. Over in Sweden, a controversial herd immunity strategy meant that the country continued business as usual amid the rest of Europe’s heightened regulations. Sweden’s COVID-19 recovery rate sits at only 13.9%, and the country’s -93% mobility rate implies that people have been taking their own precautions.
COVID-19’s Impact on the Future
It’s important to note that a “second wave” of new cases could upend plans to reopen economies. As countries reckon with these competing risks of health and economic activity, there is no clear answer around the right path to take. COVID-19 is a catalyst for an entirely different future, but interestingly, it’s one that has been in the works for a while. —Carmen Reinhart, incoming Chief Economist for the World Bank Will there be any chance of returning to “normal” as we know it?
