Puerto Rico’s Debts Are “Not Payable” According to Governor
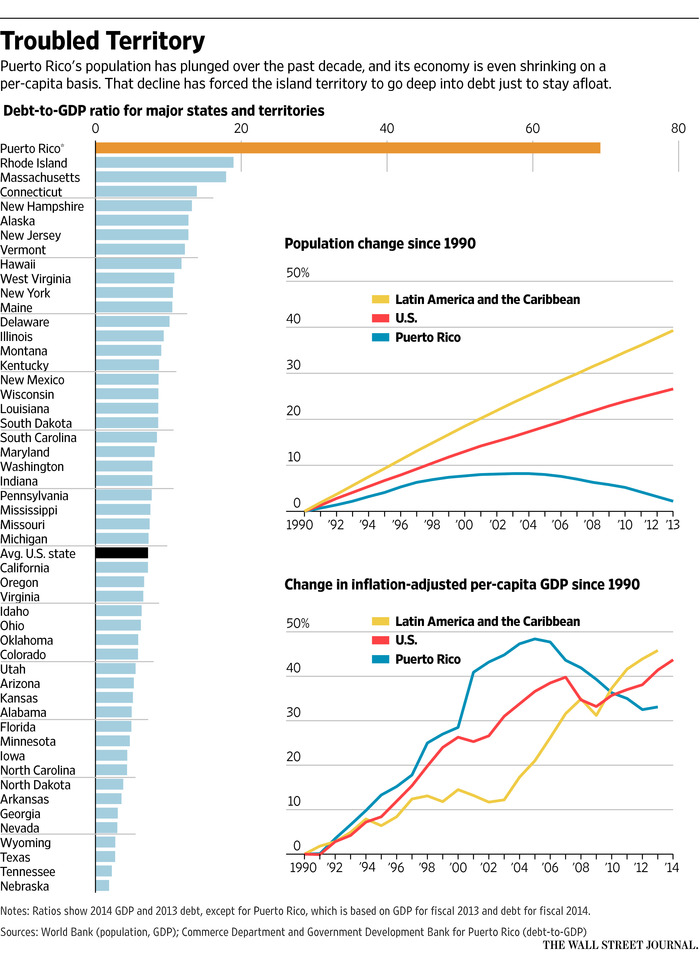
The global economy has been walking a tightrope for some time. Zero interest-rate policies, slow economic growth, and mounting debt means zero room for error. Puerto Rico is the latest jurisdiction to toss in the towel, with Governor Alejandro Garcia Padilla warning that the island is perilously close to falling into a “death spiral”. “The debt is not payable… there is no other option. This is not politics, this is math,” Garcia Padilla told the New York Times. “But we have to make the economy grow. If not, we will be in a death spiral.” Puerto Rico, as you can see in the above chart published by the WSJ, has been in a tricky situation for some time. It’s $72 billion of debt for an island of roughly 3.5 million is equal to 70% of economic output. This is a ratio that is at least three times higher than the next highest state or territory in the United States. The territory, which was ceded to the United States after the Spanish-American War, has been in trouble for awhile. The population growth rate has slowed, emigration is at record levels, and per-capita GDP has dropped over the last decade. Puerto Rico has relied on debt to try to grow the economy, and now credit-rating companies expect the first default to occur this week from the island’s electricity provider, which borrowed $9 billion. Further, the territory has been issuing new debt to pay old debt, and now the government is expected to run out of cash in July. The Puerto Rico scenario encapsulates the current challenge that the rest of the world faces. Central Banks have pulled out all the stops to try to get growth: QE, increased borrowing, ZIRP, and ongoing currency wars. However, if that growth doesn’t come at the rate needed to get the ball rolling, it makes the debt harder to service. The more leverage, the higher the stakes are. Then all that is needed is one catalyst and things can get ugly fast. Speaking of defaults: here’s what will happen if Greece defaults, and here is a breakdown of their debt.
on Last year, stock and bond returns tumbled after the Federal Reserve hiked interest rates at the fastest speed in 40 years. It was the first time in decades that both asset classes posted negative annual investment returns in tandem. Over four decades, this has happened 2.4% of the time across any 12-month rolling period. To look at how various stock and bond asset allocations have performed over history—and their broader correlations—the above graphic charts their best, worst, and average returns, using data from Vanguard.
How Has Asset Allocation Impacted Returns?
Based on data between 1926 and 2019, the table below looks at the spectrum of market returns of different asset allocations:
We can see that a portfolio made entirely of stocks returned 10.3% on average, the highest across all asset allocations. Of course, this came with wider return variance, hitting an annual low of -43% and a high of 54%.
A traditional 60/40 portfolio—which has lost its luster in recent years as low interest rates have led to lower bond returns—saw an average historical return of 8.8%. As interest rates have climbed in recent years, this may widen its appeal once again as bond returns may rise.
Meanwhile, a 100% bond portfolio averaged 5.3% in annual returns over the period. Bonds typically serve as a hedge against portfolio losses thanks to their typically negative historical correlation to stocks.
A Closer Look at Historical Correlations
To understand how 2022 was an outlier in terms of asset correlations we can look at the graphic below:
The last time stocks and bonds moved together in a negative direction was in 1969. At the time, inflation was accelerating and the Fed was hiking interest rates to cool rising costs. In fact, historically, when inflation surges, stocks and bonds have often moved in similar directions. Underscoring this divergence is real interest rate volatility. When real interest rates are a driving force in the market, as we have seen in the last year, it hurts both stock and bond returns. This is because higher interest rates can reduce the future cash flows of these investments. Adding another layer is the level of risk appetite among investors. When the economic outlook is uncertain and interest rate volatility is high, investors are more likely to take risk off their portfolios and demand higher returns for taking on higher risk. This can push down equity and bond prices. On the other hand, if the economic outlook is positive, investors may be willing to take on more risk, in turn potentially boosting equity prices.
Current Investment Returns in Context
Today, financial markets are seeing sharp swings as the ripple effects of higher interest rates are sinking in. For investors, historical data provides insight on long-term asset allocation trends. Over the last century, cycles of high interest rates have come and gone. Both equity and bond investment returns have been resilient for investors who stay the course.
