To help right the ship, the Coronavirus Aid, Relief, and Economic Security Act — also known as the CARES Act — was passed by U.S. lawmakers last week with little fanfare. The act became the largest economic stimulus bill in modern history, more than doubling the stimulus act passed in 2009 during the Financial Crisis. Today’s Sankey diagram is a visual representation of where the $2 trillion will be spent. Broadly speaking, there are five components to the COVID-19 stimulus bill: Although the COVID-19 stimulus bill is incredibly complex, here are some of the most important parts to be aware of.
Funds for Individuals
Amount: $603.7 billion – 30% of total CARES Act In order to stimulate the sputtering economy quickly, the U.S. government will deploy “helicopter money” — direct cash payments to individuals and families. The centerpiece of this plan is a $1,200 direct payment for those earning up to $75,000 per year. For higher earners, payment amounts will phase out, ending altogether at the $99,000 income level. Families will also receive $500 per child. There are three other key things to know about this portion of the stimulus funds:
Big Business
Amount: $500.0 billion – 25% of total CARES Act This component of the package is aimed at stabilizing big businesses in hard-hit sectors. The most obvious industry to receive support will be the airlines. About $58 billion has been earmarked for commercial and cargo airlines, as well as airline contractors. Perhaps in response to recent criticism of the industry, companies receiving stimulus money will be barred from engaging in stock buybacks for the term of the loan plus one year. One interesting pathway highlighted by today’s Sankey diagram is the $17 billion allocated to “maintaining national security”. While this provision doesn’t mention any specific company by name, the primary recipient is believed to be Boeing. The bill also indicates that an inspector general will oversee the recovery process, along with a special committee.
Small Business
Amount: $377.0 billion – 19% of total CARES Act To ease the strain on businesses around the country, the Small Business Administration (SBA) will be given $350 billion to provide loans of up to $10 million to qualifying organizations. These funds can be used for mission critical activities, such as paying rent or keeping employees on the payroll during COVID-19 closures. As well, the bill sets aside $10 billion in grants for small businesses that need help covering short-term operating costs.
State and Local Governments
Amount: $340.0 billion – 17% of total CARES Act The biggest portion of funds going to local and state governments is the $274 billion allocated towards direct COVID-19 response. The rest of the funds in this component will go to schools and child care services.
Public and Health Services
Amount: $179.5 billion – 9% of total CARES Act The biggest slice of this pie goes to healthcare providers, who will receive $100 billion in grants to help fight COVID-19. This was a major ask from groups representing the healthcare industry, as they look to make up the lost revenue caused by focusing on the outbreak — as opposed to performing elective surgeries and other procedures. There will also be a 20% increase in Medicare payments for treating patients with the virus. Money is also set aside for initiatives such as increasing the availability of ventilators and masks for the Strategic National Stockpile, as well as providing additional funding for the Center for Disease Control and expanding the reach of virtual doctors. Finally, beyond the healthcare-related funding, the CARES Act also addresses food security programs and a long list of educational and arts initiatives. Hat tip to Reddit user SevenandForty for inspiring this graphic. on In this infographic, we’ve visualized data from the Fed’s most recent consumer debt update.
Aggressive Borrowing
The first chart in this graphic shows the growth in outstanding car loans between Q2 2020 (start of the pandemic) to Q4 2022 (latest available). We can see that Americans under the age of 40 have grown their vehicle-related debt the most. It’s natural for Gen Z (ages 11-26) to have higher growth figures because many of them are buying their first car, but 31% is quite high relatively speaking. Part of this can be attributed to today’s inflationary environment, which has pushed used car prices to new highs. Supply chain issues have also resulted in over 30% of new cars being sold above MSRP. Because of these rising prices, the Fed reports that the average auto loan is now $24,000, up 41% from 2019’s value of $17,000.
Spiking Delinquencies
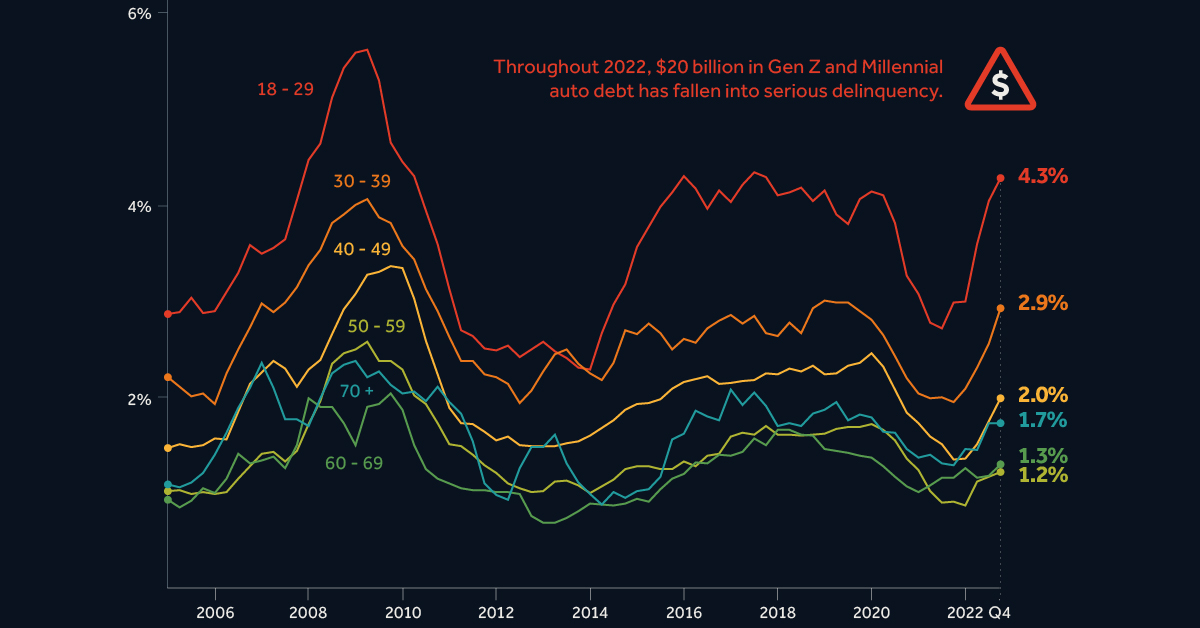
Interest rates on auto loans are typically fixed, meaning many young Americans were able to take advantage of the low rates seen during the pandemic. Despite this, one in five Gen Zs say that their car payments account for over 20% of their after-tax income. Shown in the second chart of this infographic, the amount of auto debt transitioning into serious delinquency is much higher for Gen Z and Millennials. Throughout 2022, these generations saw $20 billion in auto debt fall 90+ days behind. The outlook for these struggling borrowers is bleak. First there’s inflation, which has pushed up the prices of most consumer goods. This eats into their ability to make car payments. Second is rising interest rates, which make credit card debt—another pain point for young borrowers—even more costly. Finally, there’s student loans, which are expected to resume in summer 2023. Payments on student debt have been suspended since the beginning of the COVID-19 pandemic.
