Economic growth didn’t stop there, and GDP increased ten-fold over the last fifteen years to surpass US$10 trillion. In “real” terms using PPP, China is now actually the largest economy in the world. The rest of the world has benefited extensively from China’s coming out party. Cheap products flooded the shelves of the developed world, and China bought the world’s raw materials when no one else wanted them. Unfortunately, every good time must come to an end.
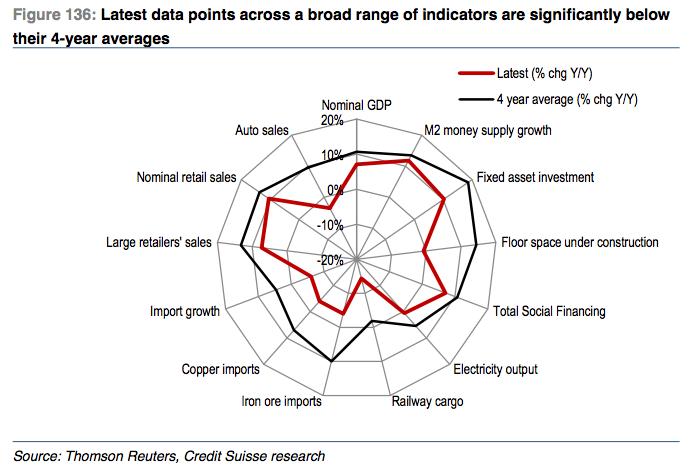
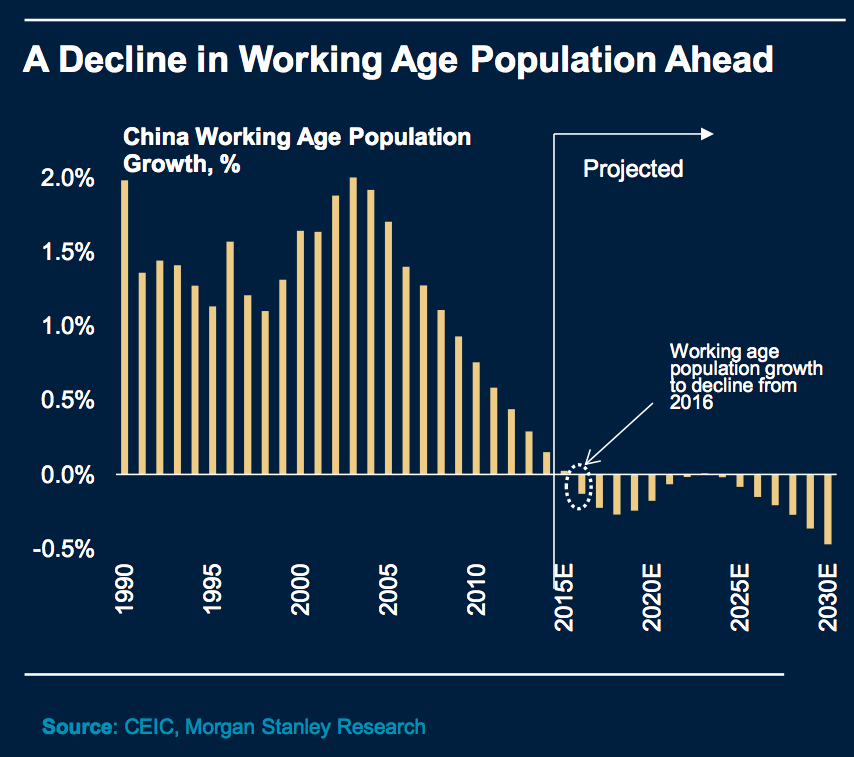
It hasn’t exactly been a secret that China’s economy has been slowing. The above radar graph from a research note by Credit Suisse shows that the economic news out of China has been tough to swallow as of late. Today, China rattled global markets even further by announcing a devaluation of the yuan by 1.9% to combat poor exports, which fell by 8.3% in July. This is the country’s largest currency devaluation since 1994. The real problem for China is far more entrenched: the country’s demographics have been a ticking timebomb for decades. The one-child policy meant that at some point in the future, the country would have an aging population that could not be replaced in the workforce. Unfortunately these demographic headwinds are now in full gear now and they are hitting China at the worst possible time. The size of China’s working population is set to begin declining.
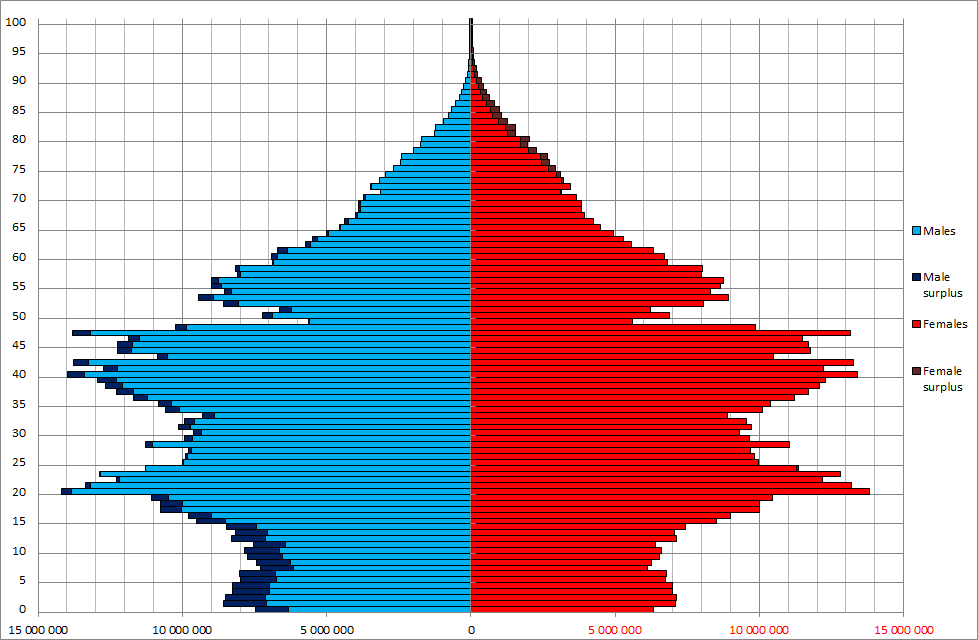
Here’s a more in-depth look at China’s population pyramid from the 2010 census. Note that those who are 15 years old are now 20, and you will see that there are not many young people to enter the workforce, as well as the fact that there is an overabundance of males in the country (a separate demographic issue).
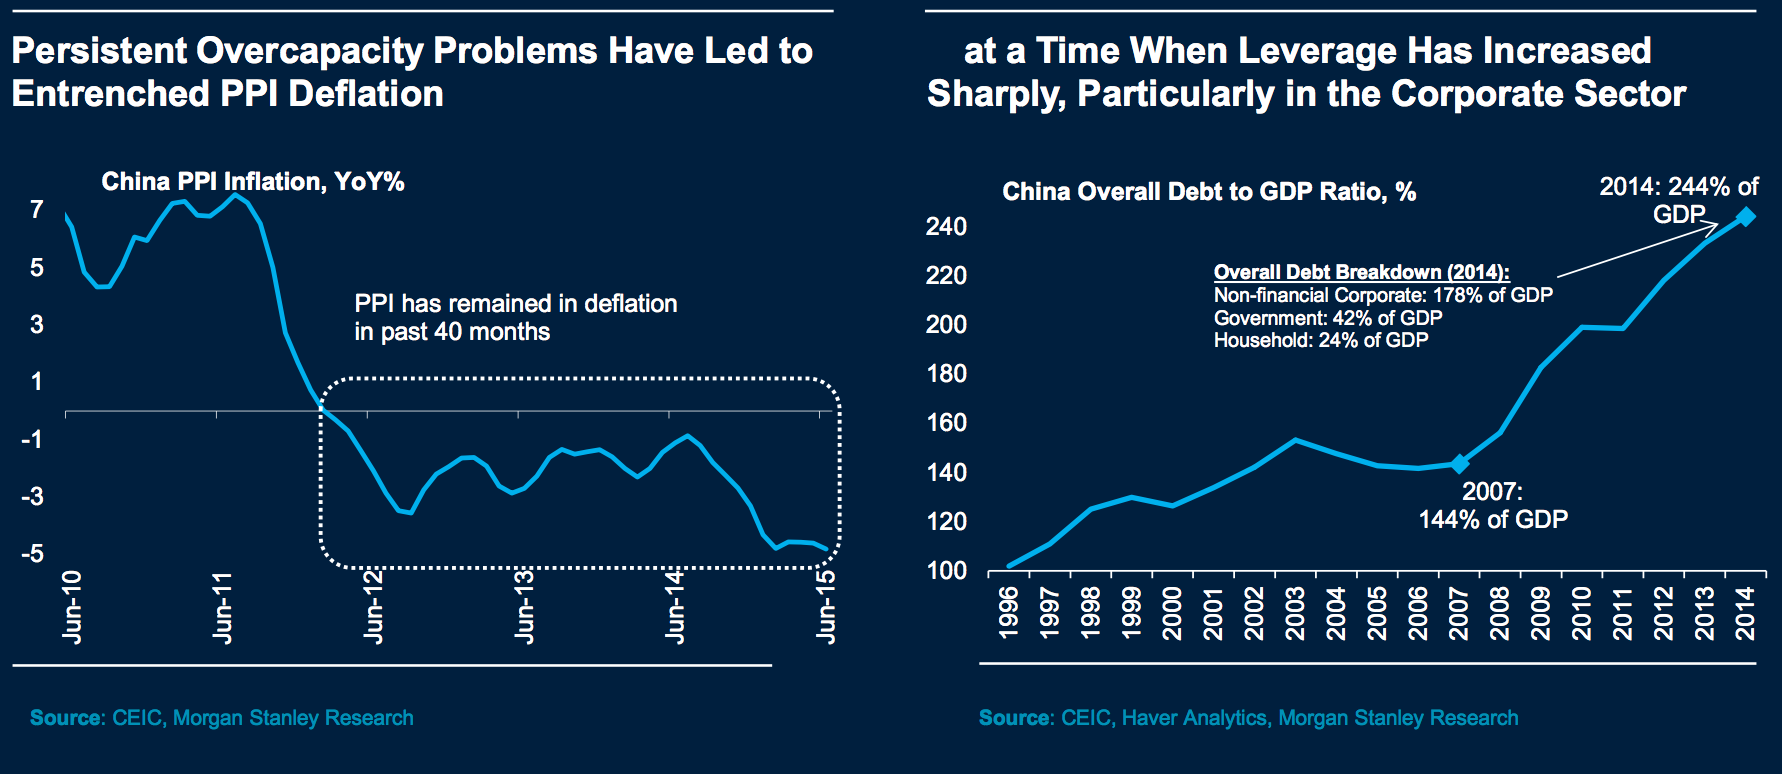
As the easy fuel for growth runs out, companies have sought to increase productivity by other means. Debt has soared for non-financial corporations in the country.
In the long run, growth is a function of changes in labour, capital and productivity. The Chinese growth engine is now sputtering: there is a shortage of young people in the workforce, exports are decreasing, investment has topped out, and its soaring debt will surely impede future growth. We must now ask (and answer) the question: When Will India be the Next China?
on Last year, stock and bond returns tumbled after the Federal Reserve hiked interest rates at the fastest speed in 40 years. It was the first time in decades that both asset classes posted negative annual investment returns in tandem. Over four decades, this has happened 2.4% of the time across any 12-month rolling period. To look at how various stock and bond asset allocations have performed over history—and their broader correlations—the above graphic charts their best, worst, and average returns, using data from Vanguard.
How Has Asset Allocation Impacted Returns?
Based on data between 1926 and 2019, the table below looks at the spectrum of market returns of different asset allocations:
We can see that a portfolio made entirely of stocks returned 10.3% on average, the highest across all asset allocations. Of course, this came with wider return variance, hitting an annual low of -43% and a high of 54%.
A traditional 60/40 portfolio—which has lost its luster in recent years as low interest rates have led to lower bond returns—saw an average historical return of 8.8%. As interest rates have climbed in recent years, this may widen its appeal once again as bond returns may rise.
Meanwhile, a 100% bond portfolio averaged 5.3% in annual returns over the period. Bonds typically serve as a hedge against portfolio losses thanks to their typically negative historical correlation to stocks.
A Closer Look at Historical Correlations
To understand how 2022 was an outlier in terms of asset correlations we can look at the graphic below:
The last time stocks and bonds moved together in a negative direction was in 1969. At the time, inflation was accelerating and the Fed was hiking interest rates to cool rising costs. In fact, historically, when inflation surges, stocks and bonds have often moved in similar directions. Underscoring this divergence is real interest rate volatility. When real interest rates are a driving force in the market, as we have seen in the last year, it hurts both stock and bond returns. This is because higher interest rates can reduce the future cash flows of these investments. Adding another layer is the level of risk appetite among investors. When the economic outlook is uncertain and interest rate volatility is high, investors are more likely to take risk off their portfolios and demand higher returns for taking on higher risk. This can push down equity and bond prices. On the other hand, if the economic outlook is positive, investors may be willing to take on more risk, in turn potentially boosting equity prices.
Current Investment Returns in Context
Today, financial markets are seeing sharp swings as the ripple effects of higher interest rates are sinking in. For investors, historical data provides insight on long-term asset allocation trends. Over the last century, cycles of high interest rates have come and gone. Both equity and bond investment returns have been resilient for investors who stay the course.
